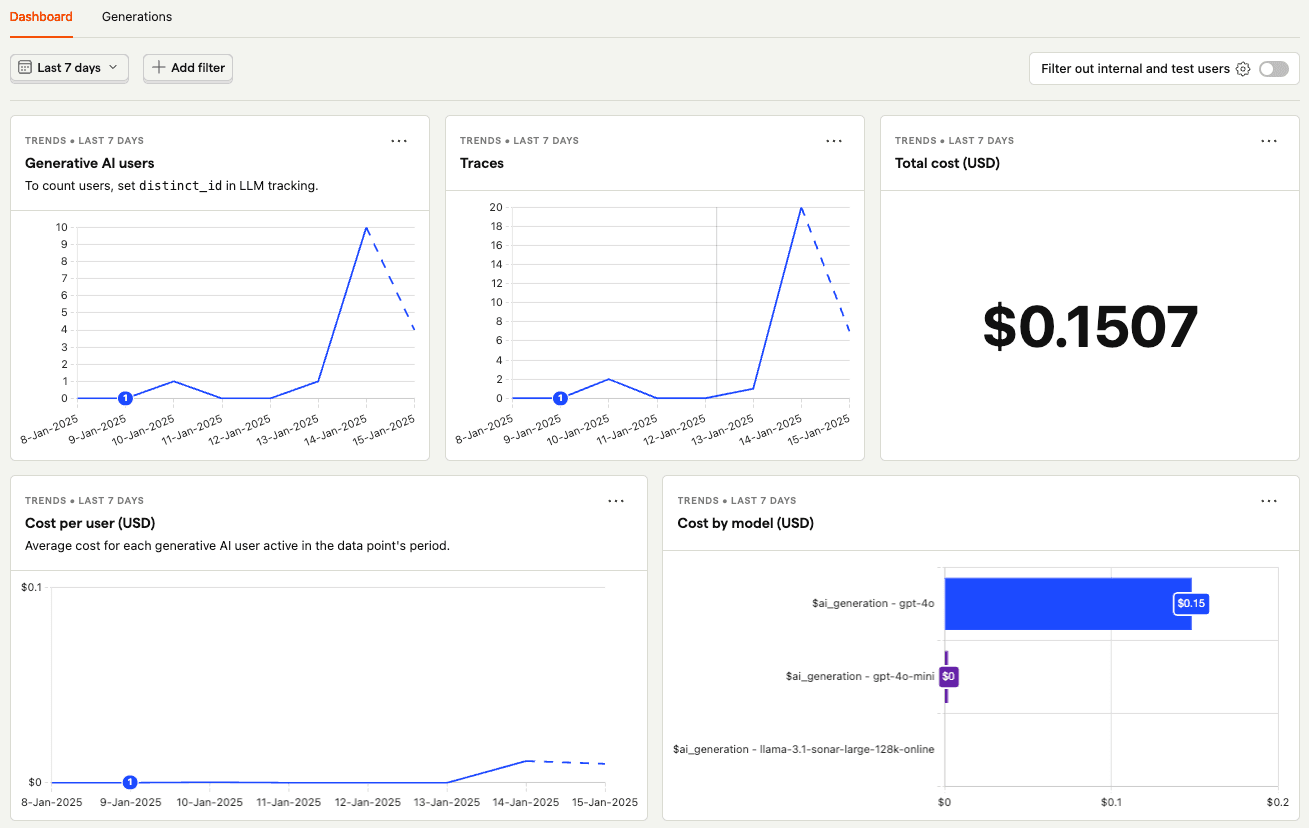
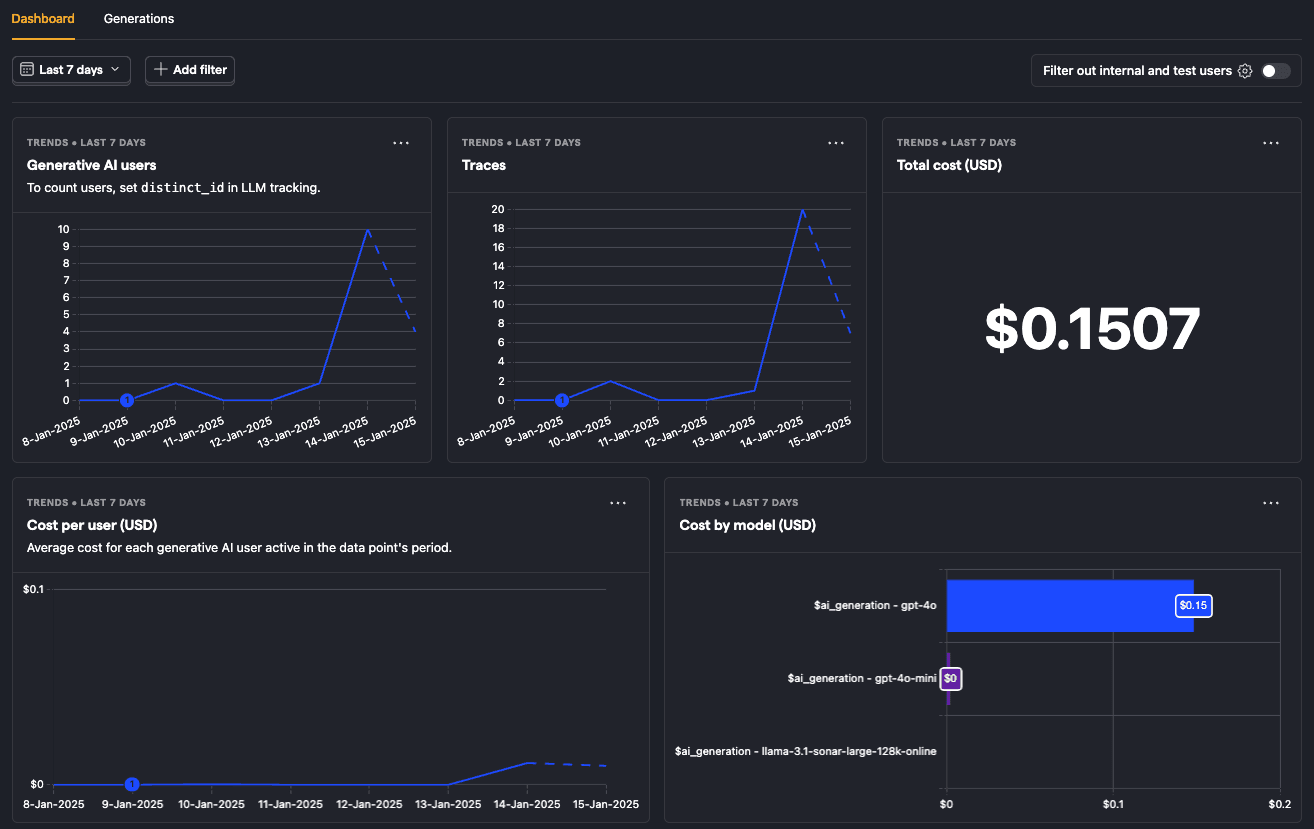
The LLM observability dashboard provides an overview of your LLM usage and performance. It includes insights on:
- Users
- Traces
- Costs
- Generations
- Latency
This dashboard is a great starting point for understanding your LLM usage and performance. You can use it to answer questions like:
- Are users using our LLM-powered features?
- What are my LLM costs by customer, model, and in total?
- Are generations erroring?
- How many of my users are interacting with my LLM features?
- Are there generation latency spikes?
To dive into specific generation events, click on the generations tab to get a list of all the recent generation events captured by PostHog.